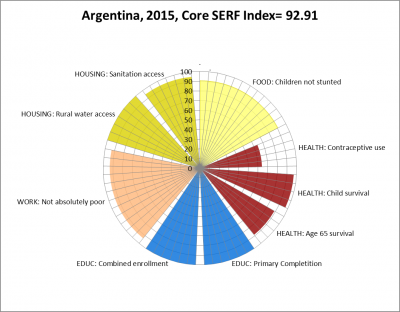
A new data visualization tool for the 2017 Update is now available that allows you to make radar plots of country performance for 2005, 2010, or 2015 evaluating performance using either the Core Index or the Supplementary Index for High Income OECD Countries. Check out this option here.